 another day, another sunrise....
 This week we celebrated reaching our sample station that is exactly halfway between the pole and equator (45N), and also the fact that we are over halfway done with our days at sea. How time flies! As I write this we are at 48N, making our way into the Alaskan Current.
Today I wanted to share a little bit about the big-picture behind this project and how we choose where to sample. A bit of history to begin…
As I mentioned before, the international World Ocean Circulation Experiment (WOCE) was a “comprehensive global hydrographic survey of physical and chemical properties, of unprecedented scope and quality, and represents the ‘state of the oceans’ during the 1990s” (http://woceatlas.ucsd.edu/). This line (P16N) was occupied in its entirety, for the first time, in April 1984. Since then, many portions of it have been resampled, with the last time being in 2006. However, there is still one small section that has never been sampled! We are in that water now so things are exciting here- everything we are collecting is new!
As we move north, we stop every ½ degree of latitude to sample, which is roughly every 50 miles. At each stop (station) we put the rosette in and take samples at 24 different depths. This water is over 5000m deep and we only get 24 samples. So how do we choose our depths?
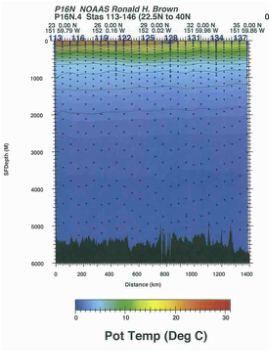 An example of our sampling scheme- color represents temperature, and each mark is a depth that we got a sample from. Notice how we scatter them in the deep sections to try and cover the entire column over a handful of stations. | From what I can tell, each cruise does it somewhat differently, but the idea is to rotate through 3 different depth “schemes” to get a full picture of the entire water column every 3 stations. In the deeper water we collect a sample every 400-500m, while above 1000 meters, we sample much more frequently (every 25-100 m). By rotating through schemes we attempt to not leave any gaps unsampled within a 2-degree space. With these samples, scientists are able to extrapolate using algorithms and other information to create section maps, which cover the entire North Pacific, like those included below. It’s pretty incredible stuff. Each time this region is reoccupied we can create new maps and look for changes between them. This always leads to further investigations about what causes those changes and if the trend is expected to continue. The maps shown here are from 1992 so we are comparing them with signals we are seeing on our stations. |
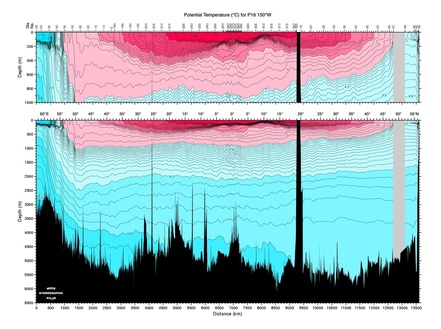 Temperature section plot, moving south (left) to north (right) in the Pacific Ocean. Pink is warmer; blue is colder. Y-axis is depth.
 Each of these section maps can contain more information than I could explain in a 10-page paper, so I won’t even attempt to go into it here, but let me point out some highlights.
First of all, the North Pacific contains the oldest water on Earth as it is the “end” of the thermohaline circulation which begins in the North Atlantic and carries water around the globe (Atlantic Ocean to Southern Ocean to the Pacific). The water in the deep Pacific hasn’t been exposed to the atmosphere for over 1,000 years. That is why it’s so important to measure the concentration of gases in this water- it tells us something about the atmosphere a long time ago.
Starting with something simple, here is a plot of the temperature throughout the water column. As you would expect, it is warmest at the surface (pinks) and gets colder as you go to depth (blues). The top plot in each of these figures is simply a zoomed-in version of the top 1000m from the bottom plot. (Note- all plots were produced by the WOCE atlas project).
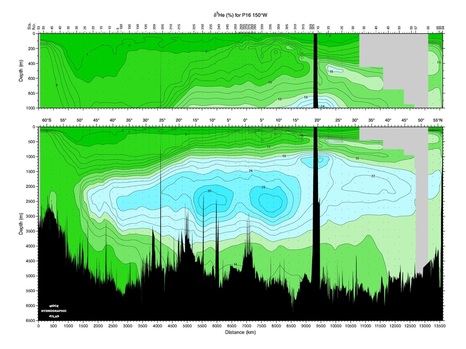
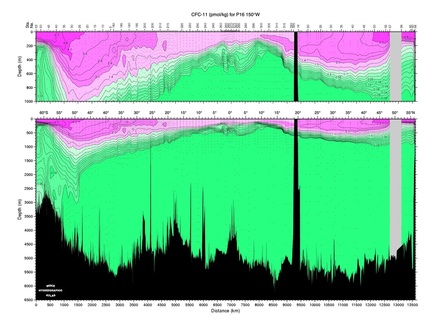 CFC section plot for the Pacific at 150W
 The CFC concentration section here shows dark pink in the surface of the ocean, representing high levels of CFCs, while the green layers are concentrations less than 1pmol/kg. Because CFCs stopped being released in the 1970s, but have a long halflife, we can track their movements in the ocean and measure circulation. Despite them being in the water for decades already, they have no infiltrated into the depths below 1000m in the Pacific Ocean. It goes to show how stratified the ocean layers here are. CFCs, despite their negative environmental impacts, they have proven very useful in oceanography studies.
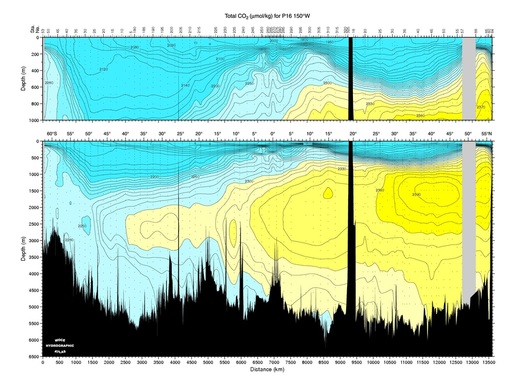 Total carbon concentration section map for the North Pacific
 Carbon (Total CO2) is another element we measure in the water. Here we see lower levels in the surface ocean than in the deep (blue to yellow scale). Carbon in the surface ocean wants to be in equilibrium with the carbon in the atmosphere and the top layer of the ocean is constantly in flux to maintain this equilibrium. Two processes move the carbon taken up from the atmosphere to the deep ocean: the solibility pump and the biological pump. The solubility pump is the process of colder water taking up more carbon (cold water holds more gas than warm water) and transporting it to the poles where it sinks due to it’s higher density, therefore taking the carbon with it into the interior ocean. The biological pump involves marine plants using CO2 to make plant tissue (just like how trees take up CO2). Because this process requires sunlight, this can only happen in the surface layers of the ocean where sunlight penetrates. Additionally, about 30% of the carbon that is used for this process gets transported and stored in the deep ocean. This is from plankton dying and sinking out of the surface layers and also by sinking poop!
One more section figure I want to show you is for helium. Helium was one of the original trace gases used to study ocean circulation (now we also use CFC, SF6, cesium, etc) as it is naturally occurring in the environment. This process is new to me as well but it’s pretty cool. First of all, samples for helium are collected in copper pipe tubes and sealed with an air pump- that alone makes it pretty awesome. Helium is naturally produced from volcanic or hydrothermal activity at the seafloor. You can see those signatures in this plot with the high levels in the interior ocean, especially near seamounts. Also, copious amounts of helium were produced as a product of the decay of tritium released by the atmospheric nuclear weapons testing in the 1950s and 60s. It’s really fascinating to be able to follow signals of global historical events through the ocean.
Last but not least, today I SAW A WHALE! During our second cast of the morning we were alerted to a whale sighting off the port side. The whales were super close to the boat, maybe 25 yards.
It looked something like this…
It looked something like this…
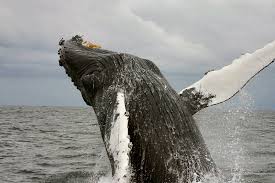
Kidding! It was more like this….
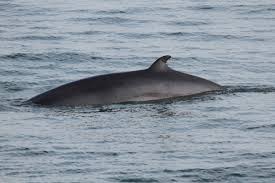
But still exciting! I’ve seen many whales in my lifetime but I must say this time was different- very powerful to see it out in the middle of nowhere-ocean.
 RSS Feed
